
Do not use these plots in your talks or papers without giving credit to us! Cite the DOI link provided by Zenodo on the download page. A NEST v2 dedicated paper is also forthcoming soon!
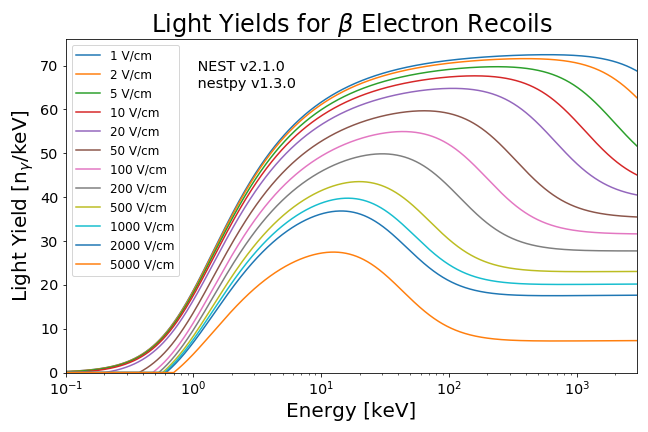
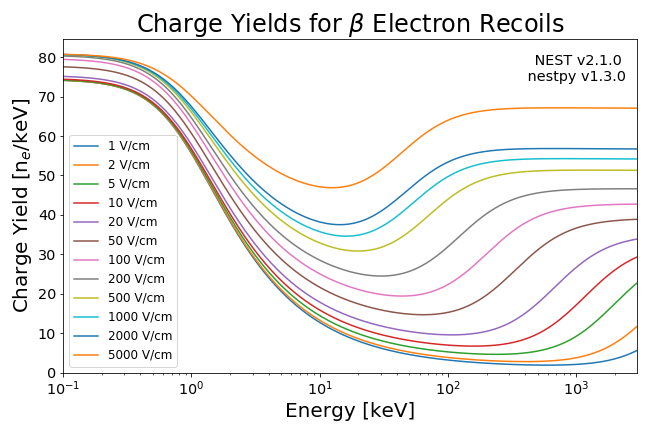
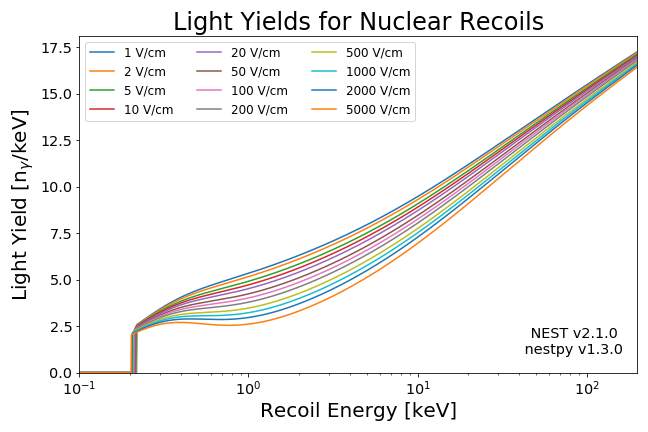
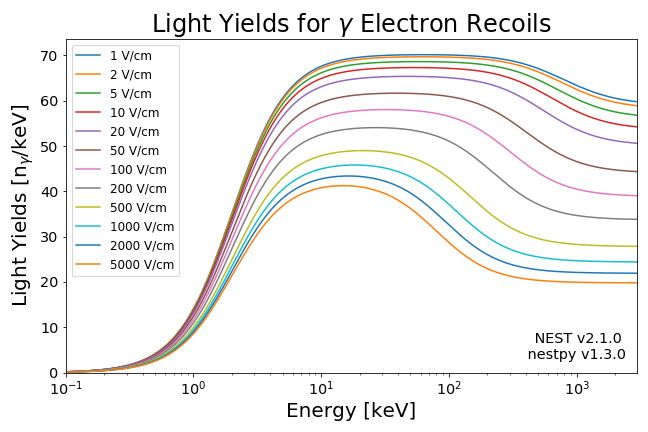
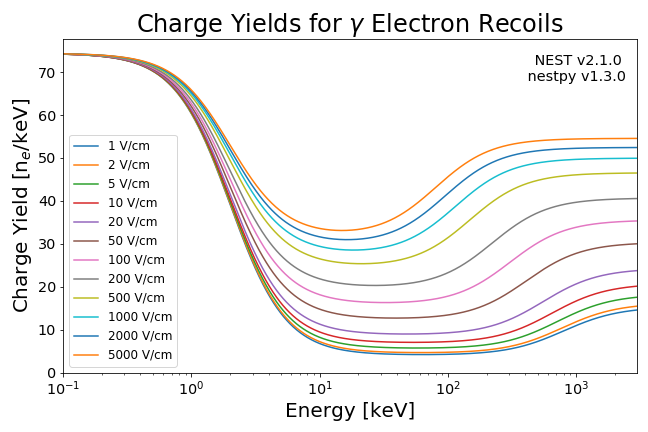
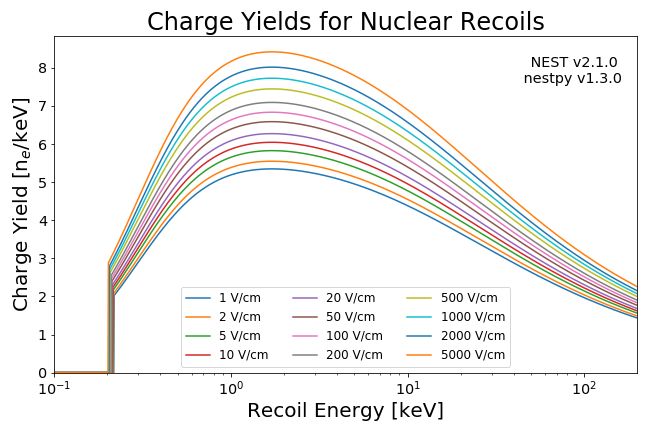
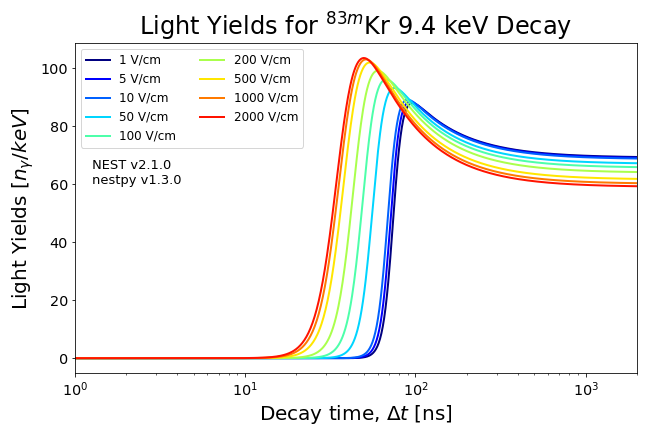
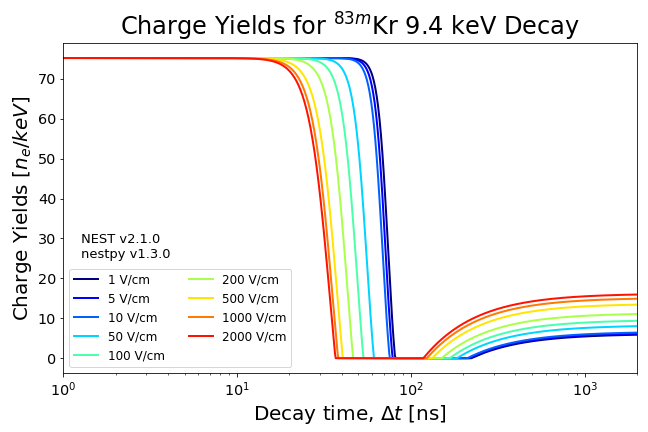
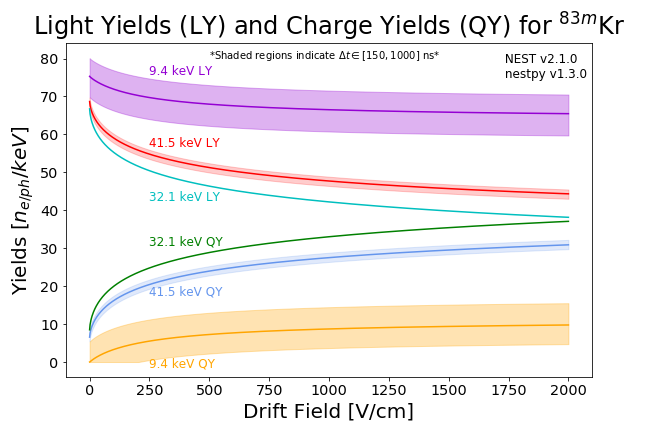
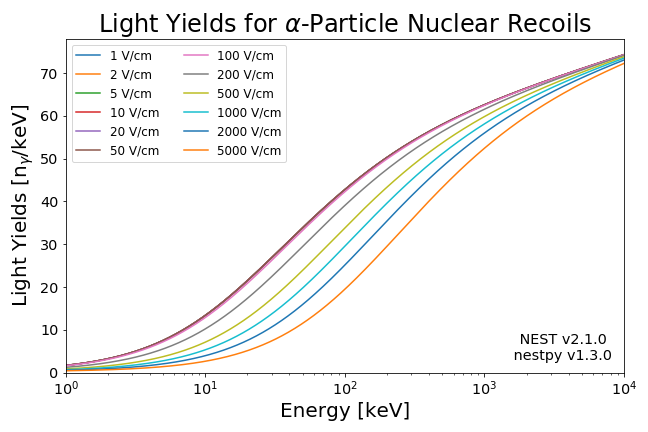
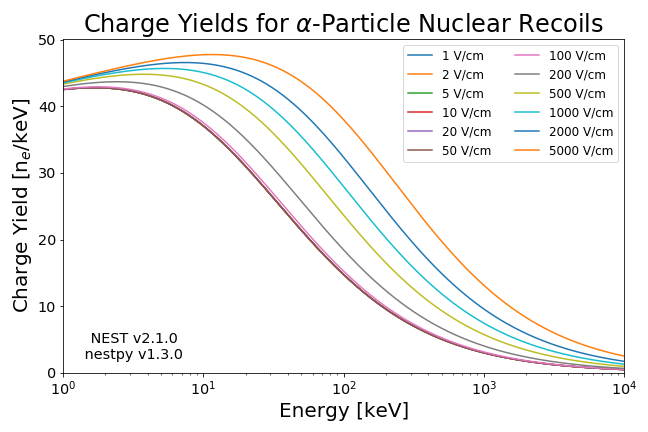
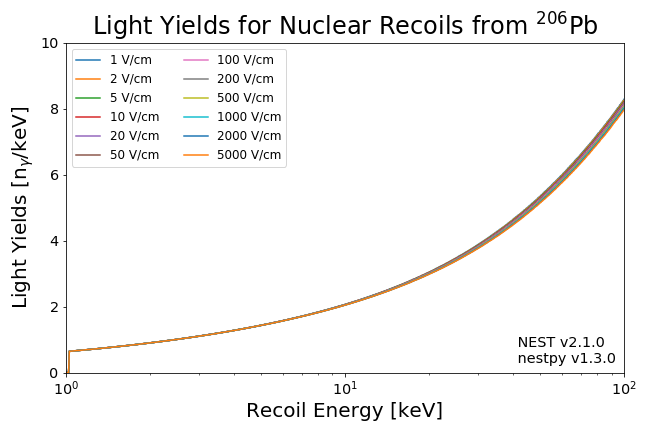
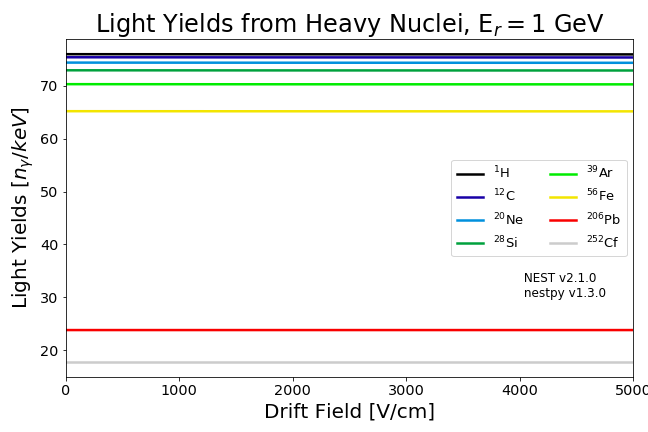
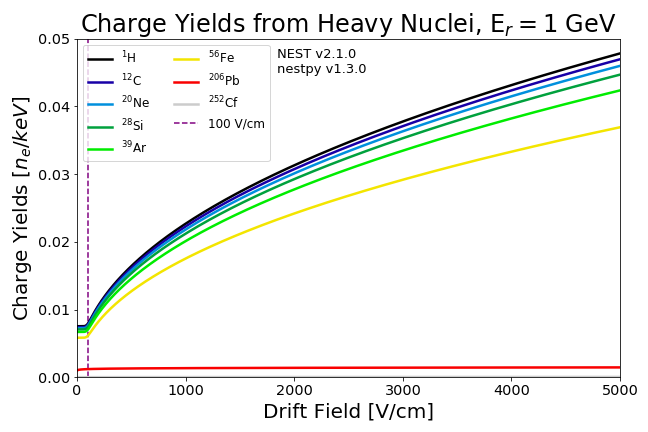
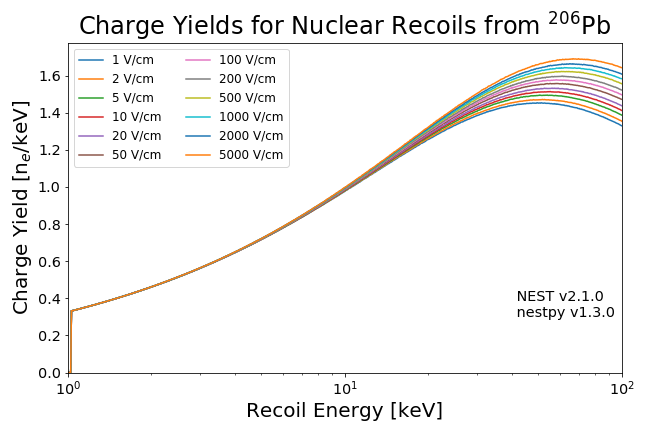
Below are a set of benchmark plots for light and charge yields in liquid xenon, for various interaction types (up to date as of NEST v2.1.0). These plots may be used to validate your install of NEST (they should be reproducible to O(1%), varying only by random number generation). Particles were generated in an essentially infinite volume of liquid xenon, since these plots are meant to exclude detector effects. You will need to install NEST and create your own detector model to take detector effects into account.
 |
 |
 |
 |
 |
 |
 |
 |
 |
 |
 |
 |
 |
 |
 |